Six on five, and a plus/minus that knows about it
Run 2026-10-03 on every regular-season game from 2010-11 to 2025-26 (19,152 games). Produced by situational_pm.py (extraction) and situational_pm_report.py (tables and figures). Companion to the goalie-pull timing study (goalie_pull_report.md).
The short version. When a trailing team pulls its goalie late in the third period, it scores 6.9 goals per 60 minutes on 6.8 xG per 60. That is almost exactly three times its 5-on-5 rate in the same window (2.2 goals, 2.4 xG). The leading team scores 21.2 goals per 60 into the empty net, ten times its 5-on-5 rate. So the trailing team gets the next goal about one time in four (24.5%). Shooters at 6-on-5 finish right at expected (goals / xG 1.02), so the xG model needs no special 6v5 adjustment. Over 16 seasons the trailing team's rate has stayed flat. The leading team's empty-net rate has crept up from about 20 to 23 per 60, because teams now fire at the empty net more often (34 unblocked attempts per 60 in 2010-11, 44 in 2025-26), even though they hit it less often.
For players, pulled-goalie time is 1.7% of skater ice time but 12% of the variance in traditional +/-. Splitting +/- by situation shows that 6-on-5 +/- carries no repeatable skill (year-over-year r = 0.02). It mostly taxes the stars coaches send out when chasing a game: Ryan O'Reilly is −104 career at 6v5. Meanwhile 5-on-6 +/- hands empty-net pluses to shutdown defencemen and closers.
Method
Game state, every second. The play-by-play logs the manpower at each event as a situation code AgAsHsHg (away goalie, away skaters, home skaters, home goalie). Between two events with the same code, the state holds. When the code changes, the switch is put at the midpoint. Each second is then classified per team:
| Bucket | Meaning |
|---|---|
| 5v5, 4v4, 3v3 | both goalies in, equal skaters |
| 6v5 | own goalie pulled, six skaters against five plus a goalie |
| 5v6 | opponent's goalie pulled, defending their six |
| PP / SH | both goalies in, unequal skaters |
| other | rarer goalie-out states: pulled on a power play (6v4), pulled while shorthanded, 4v3 in OT |
Stuck codes. Some games hold one situation code for a whole period: one 2019-20 game (BOS at PHI, 2019020711) has seven straight goals tagged as a 5-on-4 that no penalty supports. Each game's code timeline is checked against a second timeline built from the shift charts (skaters and goalie on ice per team). Normal games agree on about 98% of seconds; the gap is line-change jitter. When agreement falls below 90% and both goalies' shifts are present, the shift-chart state is used for that game. That affected 109 games in 2019-20, 10 in 2020-21 and 0-2 in other seasons.
Pulled-goalie sample. Trailing team, 6v5, last six minutes of the third period. Delayed-penalty 6v5 is excluded: a 6v5 run is flagged when it ends within 2 s of an opponent penalty, or overlaps the PBP delayed-penalty marker (2021-22 onward). Before 2021, a delayed call that ends in a goal leaves no trace, which is why the sample is limited to the final six minutes. Real pulls almost never come earlier.
Rates. Goals come from PBP goal events (each tagged by its own code). xG is the v2 shot ledger, which prices goalie-in-net unblocked attempts, so empty-net shots carry no xG. Unblocked attempts (Fenwick) and shots on goal are counted from the PBP and include empty-net shots.
Players. Shift charts give each skater's on-ice seconds per bucket (shifts are [start, end)). Players count as on ice for a goal or shot at t when start < t ≤ end. Goalies are excluded.
Validation. As a check, traditional +/- is rebuilt from the same data. A goal counts when the scorer's manpower (skaters + goalie) is no larger than the opponent's, excluding penalty shots, in periods 1-4. Against the NHL boxscore, 83.8% of 14,509 player-seasons match exactly, 98.5% are within ±1, and r = 0.999. The leftover differences are gaps in the shift charts (e.g. a scorer with no shift logged at 19:59 of a period), not counting rules.
1. The pulled-goalie deep dive
Headline rates (final six minutes of the 3rd, 2010-11 to 2025-26)
Every rate is per 60 minutes in that state, from the trailing team's point of view. For = the trailing team; Against = the leading team, which with the goalie pulled scores almost only into an empty net. FF = unblocked attempts, conv. = the leader's goals per unblocked attempt, Next goal = share of the state's goals scored by the trailing team.
| State | Hours | G/60 for | xG/60 for | G/xG | FF/60 for | Sh% | G/60 against | FF/60 against | Conv. | Next goal |
|---|---|---|---|---|---|---|---|---|---|---|
| Trailing, goalie pulled (6v5) | 231 | 6.88 | 6.77 | 1.02 | 88.3 | 11.3 | 21.17 | 34.6 | 61% | 24.5% |
| Trailing, goalie in (5v5), same window | 1,024 | 2.23 | 2.39 | 0.93 | 43.6 | 7.3 | 2.02 | 31.0 | 7% | 52.4% |
| All 5v5 (any score, any time) | 30,778 | 2.39 | 2.47 | 0.97 | 41.2 | 8.2 | 2.39 | 41.2 | 6% | 50.0% |
| Trailing, pulled on a power play etc. | 38 | 10.83 | 8.72 | 1.24 | 116.9 | 13.2 | 14.93 | 26.8 | 56% | 42.0% |
| Delayed-penalty 6v5 (reference) | 68 | 3.36 | 6.34 | 0.53 | 79.3 | 6.6 | 0.56 | 3.0 | 19% | 85.7% |
What the extra attacker buys:
- Twice the volume, better shots. Unblocked attempts double (43.6 → 88.3 per 60), and so do shots on goal (30.6 → 61.1). xG per attempt rises about 40% (0.055 → 0.077): the sixth skater gives a net-front body and point-to-slot passes. Shooting percentage goes from 7.3% to 11.3%.
- Finishing is at expectation. Goals / xG is 1.02 overall and 0.87-1.39 by season with no trend. The trailing team at 5v5 in the same window runs below xG (0.93), which suggests the leading team's score-effect shell suppresses finishing more than shot quality.
- The cost is ten times the goals against. The leading team's 21 goals per 60 come from only 35 unblocked attempts per 60, with 61% of those going in. Most possessions the leading team wins become a clear, icing-safe shot at 200 feet of open net.
- The next goal favours the leader 3:1. 24.5% of next goals go to the trailing team. Pulling still makes sense because a goal for (a tie) is worth far more than a goal against (a bigger loss). See the timing study.
- Pulled on a power play (6v4) is a different animal: 10.8 goals for against 14.9 against, and the trailing team gets the next goal 42% of the time. The delayed-penalty row is the clean contrast. Same 6v5 shot quality (6.3 xG/60), but the opponent cannot touch the puck without stopping play, so they almost never score (0.56 per 60, own-goals and the odd shot).
By deficit
| Deficit | Hours | G/60 for | xG/60 for | G/xG | G/60 against | FF/60 against | Next goal | 5v5 baseline: G · xG · GA per 60 |
|---|---|---|---|---|---|---|---|---|
| Down 1 | 115 | 6.89 | 6.71 | 1.03 | 19.76 | 31.4 | 25.8% | 2.32 · 2.50 · 1.92 |
| Down 2 | 100 | 6.62 | 6.86 | 0.97 | 22.74 | 37.6 | 22.5% | 2.27 · 2.48 · 2.18 |
| Down 3+ | 15 | 8.52 | 6.60 | 1.29 | 21.60 | 38.7 | 28.3% | 2.11 · 2.22 · 2.04 |
Attack is the same whether down one or two (about 6.7-6.9 xG/60). Defence is not. A team up two shoots at the empty net 20% more often (37.6 vs 31.4 attempts per 60) and scores 15% more (22.7 vs 19.8). The likely reason: up one, an icing (a faceoff in its own zone with a tired five on) is a real risk, so leading teams protect the puck. Up two, a miss costs less.
By time left
| Time left | Hours | G/60 for | xG/60 for | G/60 against | FF/60 against | Next goal |
|---|---|---|---|---|---|---|
| 4:00-5:00 | 4 | 6.22 | 6.10 | 18.90 | 31.3 | 24.8% |
| 3:00-4:00 | 11 | 7.08 | 6.39 | 18.00 | 31.5 | 28.2% |
| 2:00-3:00 | 35 | 6.39 | 5.95 | 17.34 | 30.3 | 26.9% |
| 1:00-2:00 | 85 | 6.26 | 6.27 | 18.58 | 30.2 | 25.2% |
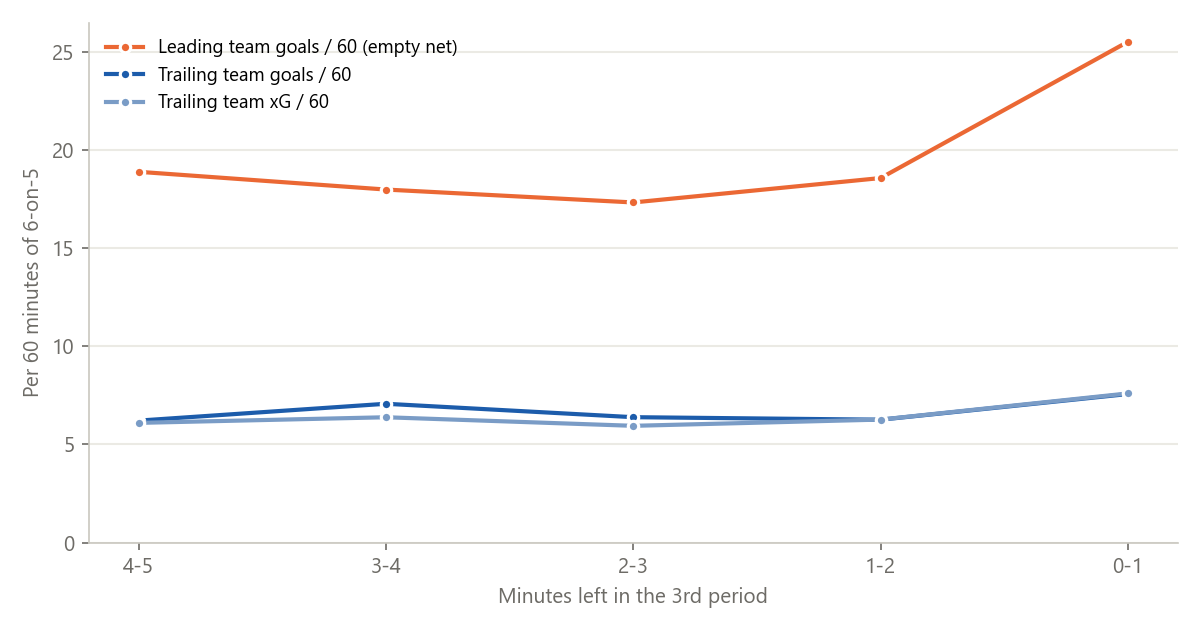
| 0:00-1:00 | 93 | 7.57 | 7.60 | 25.53 | 40.8 | 22.9% |
Rates hold steady from five minutes down to one. The final minute is different on both ends. The trailing team throws everything at the net (101 attempts per 60), and the leading team stops worrying about icing and shoots from anywhere (40.8 attempts per 60). The leading team scores at 25.5 per 60, a third more than at two or three minutes left. As the timing study noted, a pull in the final minute buys less than the average rates suggest. Early pulls (3-5 min) are no worse per minute than 1-2 minute pulls: 26-28% of next goals.
By season
| Season | Hours | G/60 for | xG/60 for | G/xG | G/60 against | FF/60 against | Conv. |
|---|---|---|---|---|---|---|---|
| 2010-11 | 9 | 8.26 | 5.95 | 1.39 | 20.27 | 33.7 | 60.1 |
| 2013-14 | 11 | 7.64 | 6.93 | 1.10 | 17.63 | 30.1 | 58.6 |
| 2016-17 | 14 | 5.29 | 6.28 | 0.84 | 19.28 | 30.1 | 63.9 |
| 2019-20 | 14 | 7.70 | 6.49 | 1.19 | 20.20 | 32.8 | 61.6 |
| 2021-22 | 18 | 7.24 | 7.05 | 1.03 | 23.91 | 35.4 | 67.5 |
| 2023-24 | 18 | 6.66 | 7.42 | 0.90 | 21.79 | 37.3 | 58.5 |
| 2024-25 | 22 | 6.43 | 7.39 | 0.87 | 21.72 | 37.9 | 57.3 |
| 2025-26 | 20 | 7.22 | 6.88 | 1.05 | 23.46 | 43.8 | 53.5 |
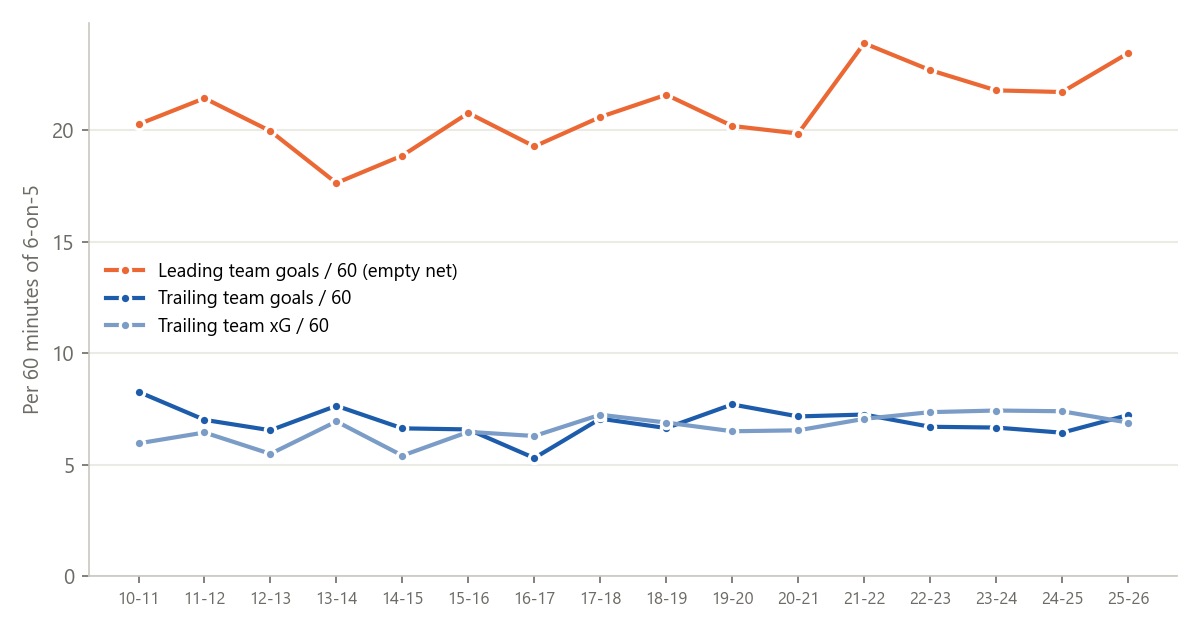
(All 16 seasons are in the log.) Pulled-goalie time more than doubled, from 9 hours a season to 20-22, as coaches pull earlier. The trailing team's scoring rate has not moved: 6.4-7.7 goals per 60, with no trend. Since about 2021 the leading team's side has changed. It now attempts 44 empty-net shots per 60 (up from about 31) and converts fewer (54% from about 63%), for a net rise in goals from about 20 to 23 per 60. Teams have stopped protecting the puck and simply shoot at the open net.
Home and away trailing teams look alike: 7.2 vs 6.6 goals per 60, with matching empty-net rates against.
2. Situational plus/minus
Definition. For every skater and season, the official +/- is split by the manpower state each goal was scored in. Even strength: 5v5, 4v4 and 3v3, where every goal counts. His power play: 5v4, 5v3 and 4v3. The official stat ignores power-play goals, so only a shorthanded goal against counts, and these columns can only be minus. His penalty kill: 4v5, 3v5 and 3v4, where only a shorthanded goal for counts, so these can only be plus. Pulled goalie: 6v5 (his goalie out) and 5v6 (theirs). Other is whatever is left of the official number, so each row adds up exactly. It is mostly empty-net goals against while his team had its goalie pulled on a power play (6-on-4), plus the odd goal the shift charts miss. Each split also carries TOI, goals for and against, and xGF/xGA, so it can be read as a rate. Goalie-in +/- = official +/- minus the 6v5 and 5v6 parts: the old stat with the empty nets taken out. All of this is on every skater card as the "Plus/minus by situation" panel.
Files: situational_pm_by_season.csv (per player-season: toi_/gf_/ga_/pm_/xgf_/xga_ × bucket — 5v5, 4v4, 3v3, 6v5, 5v6, 5v4, 5v3, 4v3, 4v5, 3v5, 3v4, PP and SH totals, rare states — trad_pm rebuilt, box_pm official) and situational_pm_career.csv (adds goalie_in_pm).
How much each state matters
| State | TOI per game (s) | SD of season +/- | YoY r: +/- per 60 | GF/60 | GA/60 | xGF/60 | xGA/60 |
|---|---|---|---|---|---|---|---|
| 5v5 | 803 | 9.15 | 0.29 | 0.44 | 0.22 | 0.68 | 0.51 |
| 4v4 | 14 | 1.05 | 0.08 | 0.07 | 0.04 | 0.16 | 0.07 |
| 3v3 | 4 | 0.85 | 0.04 | 0.11 | 0.05 | 0.16 | 0.14 |
| 6v5 | 9 | 2.53 | 0.02 | −0.03 | 0.05 | 0.16 | 0.01 |
| 5v6 | 8 | 2.15 | 0.15 | 0.20 | −0.01 | 0.00 | 0.09 |
(YoY pairs need a minimum TOI in both seasons: 500 min at 5v5, 20 min at 4v4, 10 min elsewhere.)
- 6v5 +/- is noise. It has no year-over-year signal at all (r = 0.02); the only faint skill is shot generation (xGF/60 r = 0.16). It correlates slightly negatively with 5v5 +/- (r = −0.10), because the best players get the 6v5 minutes and the empty-net goals against that come with them.
- 5v6 +/- is mostly usage. Its small persistence (r = 0.15) is goals for: some players get sent out to protect a lead and score the empty-netters. There is no persistence in preventing the trailing team's goals (GA/60 r = −0.01).
- Together, the two pulled-goalie states are 1.7% of skater ice time but 12% of the variance in traditional +/-. In 2025-26, removing them moves the median skater 34 places in the +/- ranking (rank r 0.94, 607 skaters with 41+ GP).
- 4v4 and 3v3 are too small to read for a single season (SD about 1 goal) and don't persist.
Who pays for the pulled goalie
Career, 2010-11 onward. "Pulled" = 6v5 + 5v6 +/-.
Hurt most (the stars coaches send out when chasing):
| Player | Traditional | Goalie-in | 5v5 | 4v4 | 3v3 | 6v5 | 5v6 |
|---|---|---|---|---|---|---|---|
| K. Palmieri (F) | −24 | +37 | +75 | −1 | +3 | −65 | +4 |
| J. Eberle (F) | −57 | +1 | +58 | −6 | +2 | −83 | +25 |
| S. Stamkos (F) | +4 | +60 | +122 | +4 | +5 | −84 | +28 |
| R. O'Reilly (F) | −16 | +37 | +45 | +8 | −1 | −104 | +51 |
| M. Duchene (F) | −67 | −15 | +22 | −6 | +11 | −78 | +26 |
| B. Schenn (F) | −71 | −20 | +15 | +11 | +4 | −72 | +21 |
Helped most (shutdown defencemen on the ice to close games):
| Player | Traditional | Goalie-in | 5v5 | 4v4 | 3v3 | 6v5 | 5v6 |
|---|---|---|---|---|---|---|---|
| R. McDonagh (D) | +300 | +233 | +182 | +10 | +2 | −19 | +86 |
| A. Larsson (D) | +52 | −6 | −26 | −5 | −5 | +2 | +56 |
| I. Cole (D) | +170 | +114 | +89 | −1 | +0 | +1 | +55 |
| E. Lindell (D) | +169 | +117 | +76 | +6 | +2 | −2 | +54 |
| C. Tanev (D) | +162 | +114 | +80 | +6 | +2 | −4 | +52 |
| J. Slavin (D) | +176 | +130 | +90 | +6 | −6 | −13 | +59 |
Adam Larsson is the cleanest example: +52 on the traditional stat, −6 with the goalie in.
Most 6v5 minutes, career: Giroux 485 min (68 GF, 120 GA, −52), O'Reilly 473 (−104), Tavares 439 (−92), Stamkos 437 (−84), Duchene 436 (−78), Kane 433 (−72), Ovechkin 415 (−65), MacKinnon 409 (−73). Even the best 6v5 attackers lose the minutes 2:1. Giroux's 8.4 goals per 60 and 14.8 against per 60 are about as good as it gets over a large sample.
Best 5v6 +/-, career: MacKinnon +86 (108-22), McDonagh +86, Letang +82, Carlson +77, Kucherov +72 (scoring at 30 per 60 into the empty net), Crosby +70, Marchand +69, Bergeron, McDavid and Rantanen +67.
2025-26 snapshot
| Player | GP | Traditional | 5v5 | 4v4 | 3v3 | 6v5 | 5v6 | Goalie-in |
|---|---|---|---|---|---|---|---|---|
| N. MacKinnon (COL) | 80 | +57 | +58 | +3 | −4 | −5 | +15 | +47 |
| M. Necas (COL) | 78 | +47 | +50 | +1 | −2 | −3 | +9 | +41 |
| S. Malinski (COL) | 82 | +43 | +42 | +1 | +0 | +1 | +0 | +42 |
| J. Manson (COL) | 79 | +42 | +29 | +0 | +0 | +0 | +12 | +30 |
| J. Tavares (TOR) | 82 | −28 | −11 | −1 | +1 | −18 | +8 | −18 |
| A. Panarin (NYR/LAK) | 78 | −7 | +16 | +0 | −2 | −17 | +3 | +5 |
| M. Knies (TOR) | 79 | −30 | −14 | +1 | −1 | −17 | +6 | −19 |
| A. Matthews (TOR) | 60 | −4 | +2 | +1 | +0 | −14 | +11 | −2 |
Panarin was −7 on the scoresheet and +16 at 5-on-5. He was −17 with his own goalie on the bench. Full tables for every season are in situational_pm_by_season.csv.
Caveats
- The midpoint rule puts a state change halfway between two events. Any second-level boundary error is symmetric and small next to 231 hours of pulled-goalie time.
- Pre-2021 delayed-penalty 6v5 that ends in a goal can't be flagged. The six-minute window keeps that leakage to a handful of goals a season. In the player buckets, 6v5 means the state itself, so the roughly 15 delayed-penalty goals a season (league-wide) stay in. That is about 0.02 goals per skater.
- Shift charts are occasionally incomplete, which is the source of the ±1 validation misses. Box-score +/- and the rebuilt +/- disagree by more than 1 for 1.5% of player-seasons.
- Per-player 6v5 and 5v6 rates are descriptive. With r = 0.02, a player's 6v5 +/- should not be used to judge him.