Who fills the building? NHL attendance, 2007-08 to 2025-26
Run 2026-10-03 on every regular-season and playoff game from 2007-08 to 2025-26 (22,842 regular-season games, 1,700 playoff games). Produced by fetch_attendance.py (hockey-reference schedule pages, the only long attendance record; nothing before 2007-08 is listed) and attendance_study.py (tables and figures).
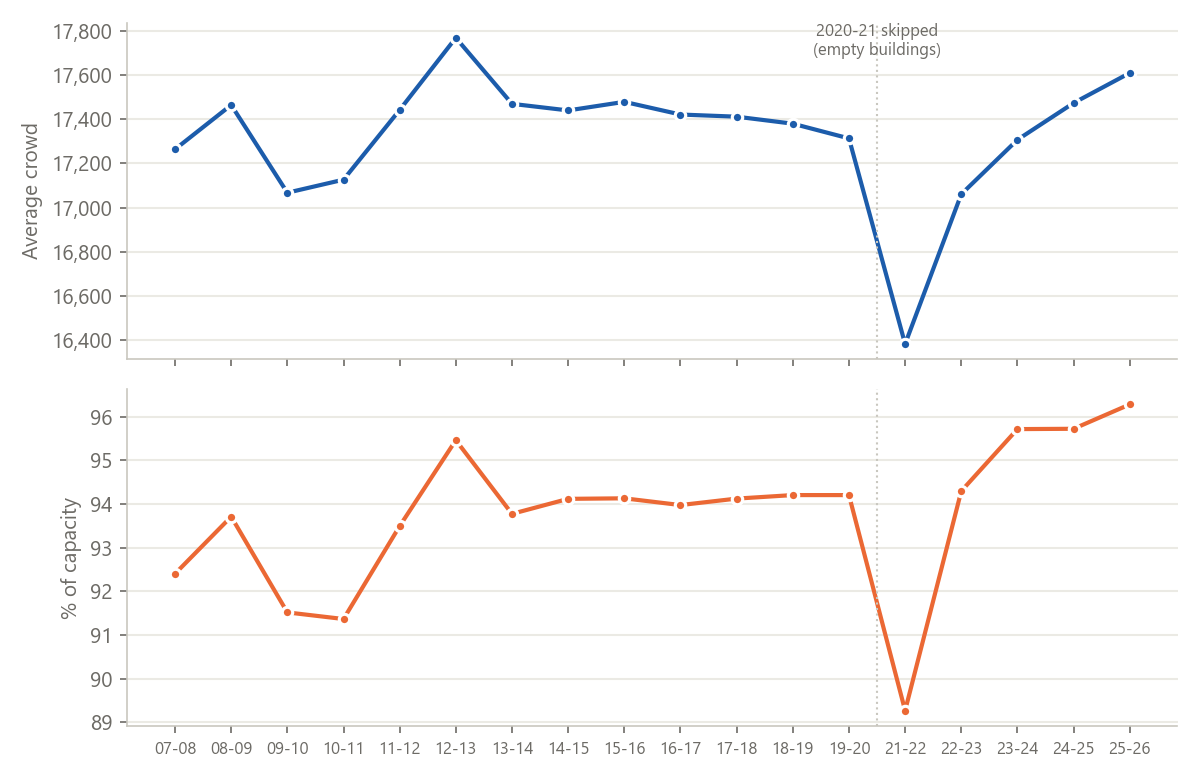
The short version. NHL buildings are fuller than they have ever been in this record. The 2025-26 season averaged 17,651 a game and 23.2 million in total, both the highest for a full season, and home buildings ran at 96.3% of capacity. Only one of 32 teams filled less than 90% of its seats, against 12 of 30 in 2009-10. The big story of the last decade is convergence: the spread in fill rate between teams shrank from about 9 points to 3.4. The sun-belt teams that used to play to two-thirds-empty rinks (Florida, Carolina, the Islanders, Dallas, Tampa) now sell out, while the traditional sell-outs in Canada, Chicago and Pittsburgh have slipped a little. US buildings passed Canadian ones in 2025-26 for the first time.
Within a season, demand is mostly calendar and opponent. In buildings that are not already sold out, a Saturday draws about 1,200 more than a Monday, April about 1,100 more than October, and New Year's Eve about 1,100 more than the team's usual crowd. Pittsburgh, the Rangers, Chicago, Boston and Detroit are the best road draws (+610 to +850 fans), and Original Six teams draw extra in sun-belt rinks. Star power is visible and fades: Chicago's dynasty and Crosby's peak were worth 1,500-1,900 fans a visit, McDavid turned Edmonton from the league's worst draw into one of its best.
Winning sells tickets, mostly a year late. Sixteen extra standings points (+0.100 points%) adds about 230 fans a game the same season and about 400 the next. Crowds do not create home-ice advantage: the 2020-21 empty-building games kept a home edge (+4.0 win%) close to the normal one (+4.7), and among normal games a sold-out rink is no better for the home team than a half-empty one.
Data and method
Source. hockey-reference's season schedule pages list the announced attendance for every game since 2007-08. The project's own 2010-21 results files came from the NHL stats API, which carries no attendance, so this is a new pull (Data/attendance_games.csv, 32,440 rows back to 2000-01; attendance is blank before 2007-08). Announced attendance is tickets distributed, not people through the turnstile, and some teams report the same figure every night; a "sell-out" here is a reporting fact, not a head count.
Buildings. Each home game is tied to a building, not just a team: Pittsburgh (Mellon Arena → PPG Paints 2010), Edmonton (Rexall → Rogers Place 2016), Detroit (Joe Louis → Little Caesars 2017), the Islanders (Nassau → Barclays 2015 → split → UBS Arena 2021), Arizona (Glendale → Mullett Arena 2022), plus the Atlanta → Winnipeg and Arizona → Utah moves. Outdoor games, the European and Asian season openers and other neutral-site games (86 games) are kept out of every team number and reported separately.
Capacity. There is no capacity table, so capacity is read from the attendance itself: the median of the five biggest crowds in that building that season, regular season and playoffs together. A sold-out team reports the same number night after night, so its five biggest crowds are its capacity. A struggling team still fills up for Toronto or a playoff game, so its biggest crowds come close. If a season's figure is under 98% of the same building's figure in the two seasons either side, the team never filled the building that year and 98% of the neighbouring figure is used instead. Fill is attendance / capacity; sold out is fill ≥ 99%. Chicago and Montreal sell standing room, so their "capacity" is the standing-room figure.
Restricted games. 2020-21 (empty or capped buildings) and Canadian home games in 2021-22 before 1 March 2022 that drew under 85% of capacity (provincial limits) are dropped from trend and demand numbers. That removes 868 + 87 games.
Demand model. A sold-out building cannot show a rise in demand, so calendar and opponent effects are fitted only on team-seasons where fewer than half the home games sold out (12,895 games, 327 team-seasons). The model is ordinary least squares on attendance with a fixed effect per home team-season, plus month, day of week and visiting team. The team-season effect absorbs the building, the market, ticket prices and how good the home team is that year, so the other effects are within-season differences. Residual SD is 1,311 fans a game.
1. The league, season by season
| Season | Games | Avg (all) | Total (M) | Avg, home buildings | Fill % | Sold out % | Under 15k % | Teams ≥ 90% full | Playoff avg |
|---|---|---|---|---|---|---|---|---|---|
| 2007-08 | 1,230 | 17,307 | 21.29 | 17,263 | 92.4 | 47 | 16.8 | 19 of 30 | 18,671 |
| 2008-09 | 1,230 | 17,476 | 21.50 | 17,464 | 93.7 | 49 | 15.9 | 20 | 18,846 |
| 2009-10 | 1,230 | 17,070 | 21.00 | 17,067 | 91.5 | 45 | 20.2 | 18 | 19,128 |
| 2010-11 | 1,230 | 17,164 | 21.11 | 17,126 | 91.4 | 47 | 20.0 | 19 | 18,737 |
| 2011-12 | 1,230 | 17,454 | 21.47 | 17,442 | 93.5 | 52 | 14.9 | 21 | 18,515 |
| 2012-13 | 720 | 17,768 | 12.79 | 17,768 | 95.5 | 57 | 8.9 | 25 | 18,973 |
| 2013-14 | 1,230 | 17,690 | 21.76 | 17,469 | 93.8 | 48 | 14.2 | 20 | 19,092 |
| 2014-15 | 1,230 | 17,503 | 21.53 | 17,439 | 94.1 | 49 | 13.1 | 24 | 19,116 |
| 2015-16 | 1,230 | 17,572 | 21.61 | 17,478 | 94.1 | 48 | 14.3 | 24 | 18,513 |
| 2016-17 | 1,230 | 17,516 | 21.55 | 17,421 | 94.0 | 47 | 16.6 | 22 | 18,464 |
| 2017-18 | 1,271 | 17,446 | 22.17 | 17,411 | 94.1 | 44 | 14.8 | 24 of 31 | 18,071 |
| 2018-19 | 1,271 | 17,456 | 22.19 | 17,379 | 94.2 | 40 | 13.9 | 25 | 18,100 |
| 2019-20 | 1,082 | 17,408 | 18.84 | 17,313 | 94.2 | 43 | 14.0 | 25 | bubble, no fans |
| 2020-21 | 868 | 3,242* | 1.00 | 10,834* | |||||
| 2021-22 | 1,312 | 15,963 | 20.78 | 16,383 | 89.3 | 31 | 25.0 | 19 of 32 | 18,603 |
| 2022-23 | 1,312 | 17,101 | 22.44 | 17,060 | 94.3 | 48 | 14.6 | 24 | 18,360 |
| 2023-24 | 1,312 | 17,434 | 22.87 | 17,307 | 95.7 | 51 | 10.5 | 29 | 18,482 |
| 2024-25 | 1,312 | 17,542 | 23.01 | 17,473 | 95.7 | 48 | 10.0 | 29 | 18,516 |
| 2025-26 | 1,312 | 17,651 | 23.16 | 17,609 | 96.3 | 49 | 9.0 | 31 of 32 | 18,507 |
\* 2020-21: 558 of 868 games had no fans at all; the average is over the 310 games that let some in.
- Flat for a decade, then a post-pandemic climb. Per game, the league sat at 17,400-17,500 from 2011 to 2020. The 2021-22 return was soft (15,963; Buffalo drew under 10,000 for 29 home games, Arizona's last Glendale season ran at 69%), but every season since has set a new high in fill. 2025-26 trails only the 48-game 2012-13 season per game, which was a short, pent-up post-lockout schedule.
- Totals grew with expansion. Vegas (2017) and Seattle (2021) added 82 home dates between them, so 2025-26's 23.2 million is 1.9 million more than 2007-08 on almost the same per-game figure.
- The empty-seat tail is shrinking. The share of games under 15,000 fell from 20% in 2009-11 to 9% in 2025-26.
2. Teams
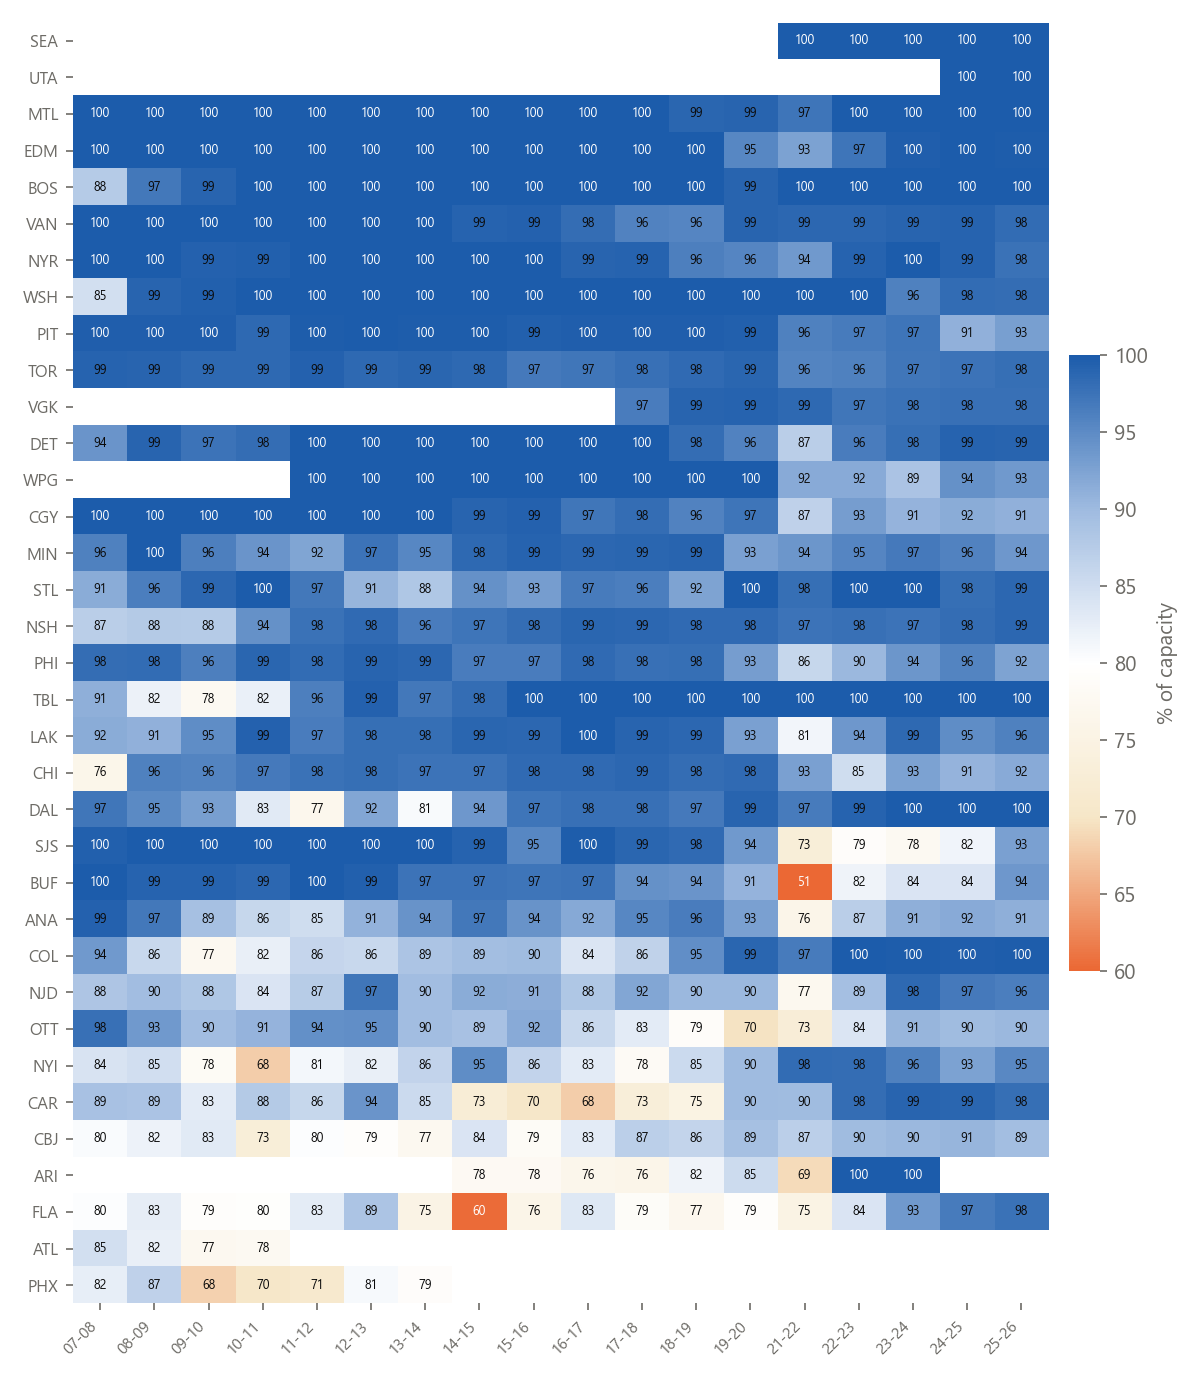
2025-26, with the change since 2018-19 (the last full pre-pandemic season)
| Team | Avg 2025-26 | Capacity | Fill % | Sold out % | Avg 2018-19 | Change | Fill, 2008-26 |
|---|---|---|---|---|---|---|---|
| MTL | 20,962 | 20,962 | 100.0 | 100 | 21,047 | −85 | 99.7 |
| FLA | 19,414 | 19,894 | 97.6 | 20 | 13,256 | +6,158 | 81.6 |
| DET | 19,319 | 19,515 | 99.0 | 83 | 19,121 | +198 | 97.9 |
| TBL | 19,092 | 19,092 | 100.0 | 100 | 19,092 | 0 | 95.7 |
| CHI | 18,949 | 20,668 | 91.7 | 17 | 21,399 | −2,450 | 94.4 |
| TOR | 18,667 | 19,078 | 97.8 | 34 | 19,276 | −609 | 98.0 |
| VAN | 18,662 | 18,992 | 98.3 | 29 | 18,022 | +639 | 98.9 |
| DAL | 18,532 | 18,532 | 100.0 | 100 | 18,178 | +354 | 94.2 |
| PHI | 18,485 | 20,005 | 92.4 | 10 | 19,141 | −655 | 95.9 |
| CAR | 18,373 | 18,761 | 97.9 | 5 | 14,322 | +4,051 | 85.9 |
| EDM | 18,308 | 18,347 | 99.8 | 90 | 18,347 | −39 | 99.1 |
| COL | 18,120 | 18,154 | 99.8 | 100 | 17,133 | +988 | 91.0 |
| MIN | 18,023 | 19,244 | 93.7 | 17 | 18,908 | −884 | 96.3 |
| WSH | 17,990 | 18,347 | 98.1 | 66 | 18,508 | −519 | 98.6 |
| VGK | 17,929 | 18,339 | 97.8 | 5 | 18,319 | −390 | 97.9 |
| BUF | 17,853 | 19,070 | 93.6 | 59 | 17,908 | −55 | 92.2 |
| BOS | 17,850 | 17,850 | 100.0 | 100 | 17,565 | +285 | 99.0 |
| STL | 17,847 | 18,096 | 98.6 | 80 | 17,362 | +485 | 96.1 |
| NYR | 17,576 | 18,006 | 97.6 | 41 | 17,319 | +257 | 98.8 |
| CGY | 17,549 | 19,289 | 91.0 | 7 | 18,501 | −953 | 96.6 |
| LAK | 17,435 | 18,145 | 96.1 | 61 | 18,001 | −565 | 95.6 |
| NSH | 17,237 | 17,457 | 98.7 | 25 | 17,446 | −209 | 96.0 |
| SEA | 17,151 | 17,151 | 100.0 | 100 | 100.0 | ||
| OTT | 17,123 | 18,988 | 90.2 | 0 | 14,553 | +2,570 | 87.5 |
| PIT | 17,081 | 18,384 | 92.9 | 32 | 18,566 | −1,485 | 98.2 |
| CBJ | 16,878 | 18,864 | 89.5 | 15 | 16,658 | +220 | 83.9 |
| NYI | 16,439 | 17,255 | 95.3 | 66 | 12,443 | +3,997 | 86.8 |
| SJS | 16,173 | 17,435 | 92.8 | 54 | 17,266 | −1,093 | 93.8 |
| NJD | 16,145 | 16,763 | 96.3 | 10 | 14,904 | +1,241 | 90.3 |
| ANA | 15,670 | 17,174 | 91.2 | 10 | 16,814 | −1,145 | 91.4 |
| WPG | 14,228 | 15,225 | 93.5 | 22 | 15,321 | −1,093 | 97.1 |
| UTA | 12,478 | 12,478 | 100.0 | 100 | 100.0 |
Capacity is the reported sell-out figure as estimated above; teams that report the identical number every sold-out night (Tampa 19,092, Boston 17,850, Seattle 17,151) show 100%.
The long run: who always fills, who never did
Always full. Montreal (99.8% over 18 seasons, 92% of games sold out), Edmonton (99.3%), Boston (99.0%), Vancouver, the Rangers, Washington and Pittsburgh (all ≥ 98%). Seattle has reported a sell-out for every home game it has played.
The sun-belt turnaround. Florida averaged 60% of capacity in 2014-15 and 77-79% as late as 2018-20; three straight Cup Finals later it is at 98%. Carolina went from 68% (2016-17) to 98-99% since 2022-23. Dallas was at 77% in 2011-12 and has sold out every game for three seasons. Tampa has sold out every game since 2015-16. Colorado went from 77% (2009-10) to 100%.
New buildings. The Islanders were the league's emptiest northern team at Nassau and Barclays (68-90%); UBS Arena has run at 93-98% since it opened. Edmonton's move to Rogers Place added 1,500 seats and still sold out. Pittsburgh's move to a 1,600-seat-bigger building in 2010 sold out for a decade. Arizona drew 76-85% in Glendale and then "sold out" the 4,600-seat Mullett Arena; Utah has announced a sell-out for every home game in both its seasons, adding about 1,350 seats for the second.
Relocation. Atlanta's last four seasons averaged 80% of an 18,500-seat building; the same franchise in Winnipeg sold out a 15,000-seat building for nine straight seasons.
The slippage. Chicago's run of 21,000-22,000 crowds ended with the rebuild (−2,450 since 2018-19, from 98% to 85-93%). Pittsburgh dipped to 91-93% in 2024-26 after 13 years at 99-100%. San Jose fell from 98% to 73-82% in 2021-25 before rebounding to 93% in Macklin Celebrini's second season. Winnipeg has not sold out a full season since 2019-20 (89-94%). Ottawa bottomed at 70% in 2019-20 and has recovered to 90%. Calgary and Minnesota are a few points off their peaks.
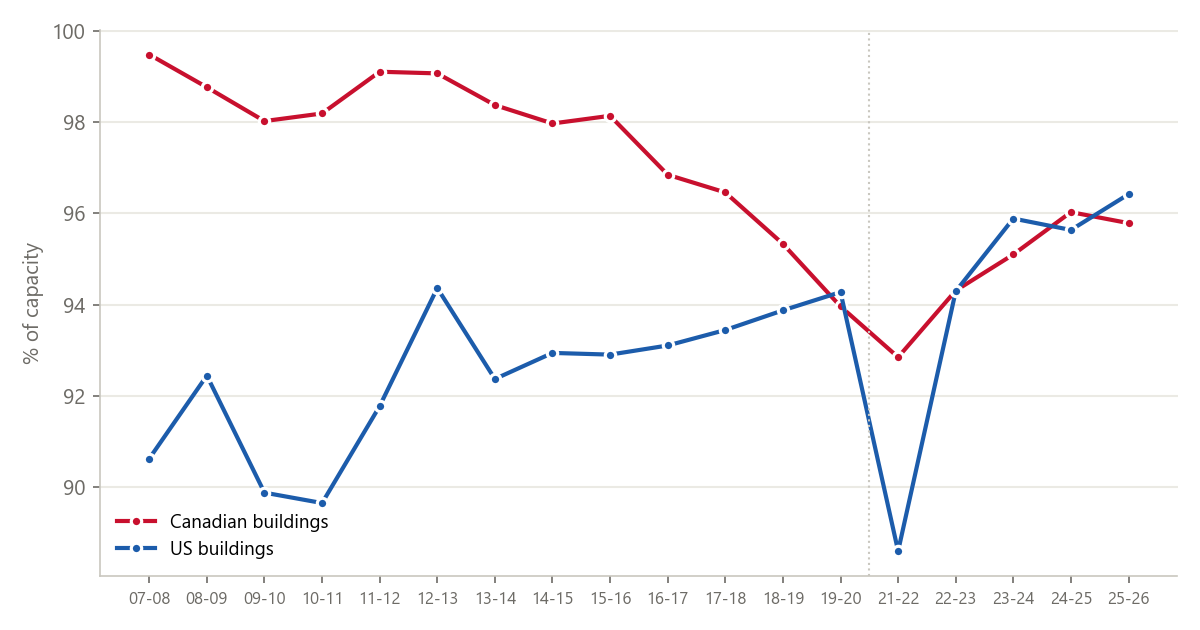
Canada vs US. Canadian buildings filled 98-99.5% through 2015-16 and US buildings 90-93%. Since then the Canadian rate has eased to 95.8% (Ottawa, Winnipeg, Calgary) and the US rate has climbed to 96.4%, passing Canada for the first time in 2025-26. The standard deviation of fill across teams fell from 7-10 points (2007-20) to 3.4 points in 2025-26: attendance has never been this even across the league.
3. The calendar
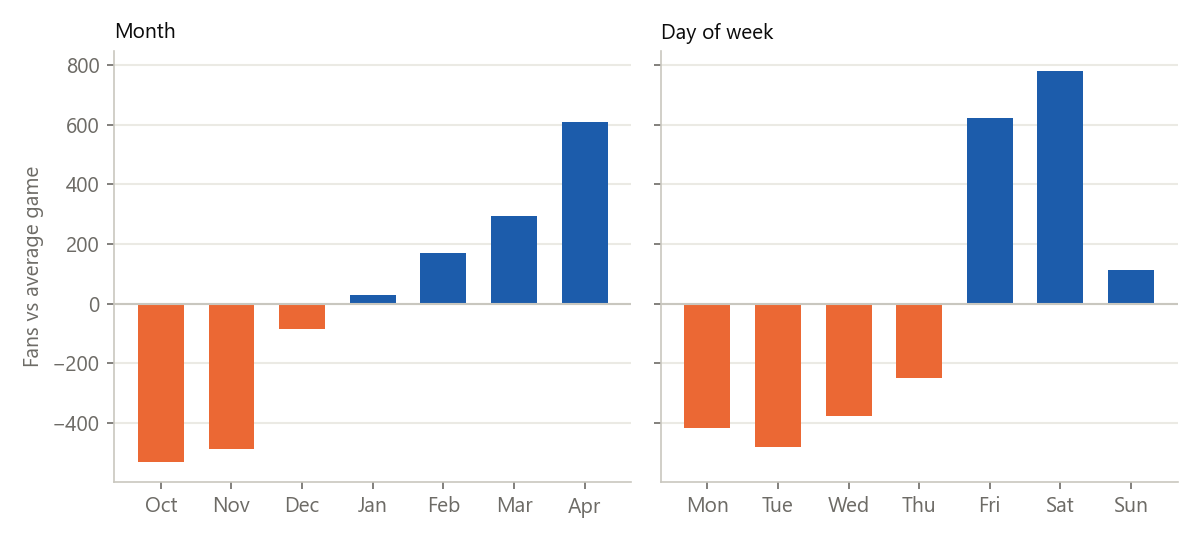
The demand model, fitted in team-seasons with room to grow (fans relative to the reference level; the chart re-centres on the average month and day):
| Month | vs October | Day | vs Monday | |
|---|---|---|---|---|
| Oct | 0 | Mon | 0 | |
| Nov | +43 | Tue | −62 | |
| Dec | +447 | Wed | +40 | |
| Jan | +559 | Thu | +168 | |
| Feb | +701 | Fri | +1,040 | |
| Mar | +825 | Sat | +1,197 | |
| Apr | +1,141 | Sun | +531 |
- The season builds. October and November are the softest months, and the build is steady through April. The same pattern shows up in all buildings, not only unsold ones (+376 above the team-season average in April, −320 in October). The usual story is that football season, mild weather and an unsettled standings race keep fans away early.
- April does not depend on the playoff race. In unsold buildings, eventual non-playoff teams drew +647 above their own season average in April and playoff teams +564. Teams out of the race do not lose the gate in the final weeks; season-ticket holders using the last of their tickets and closing-week promotions probably carry it.
- Friday and Saturday are worth over 1,000 fans. Tuesday is the worst night. Sunday sits halfway.
- Start time. Afternoon starts (before 3:30 pm local) run +360 above the team-season average in unsold buildings, 7:30 pm or later −163. Most afternoon games are weekends and holidays, so this mostly overlaps the day-of-week effect.
- Holidays. Relative to the team's own season average, in unsold buildings: New Year's Eve +1,080, Dec 26-27 +940, Black Friday +653, Jan 1 +385, Dec 23 +350.
4. Who draws on the road
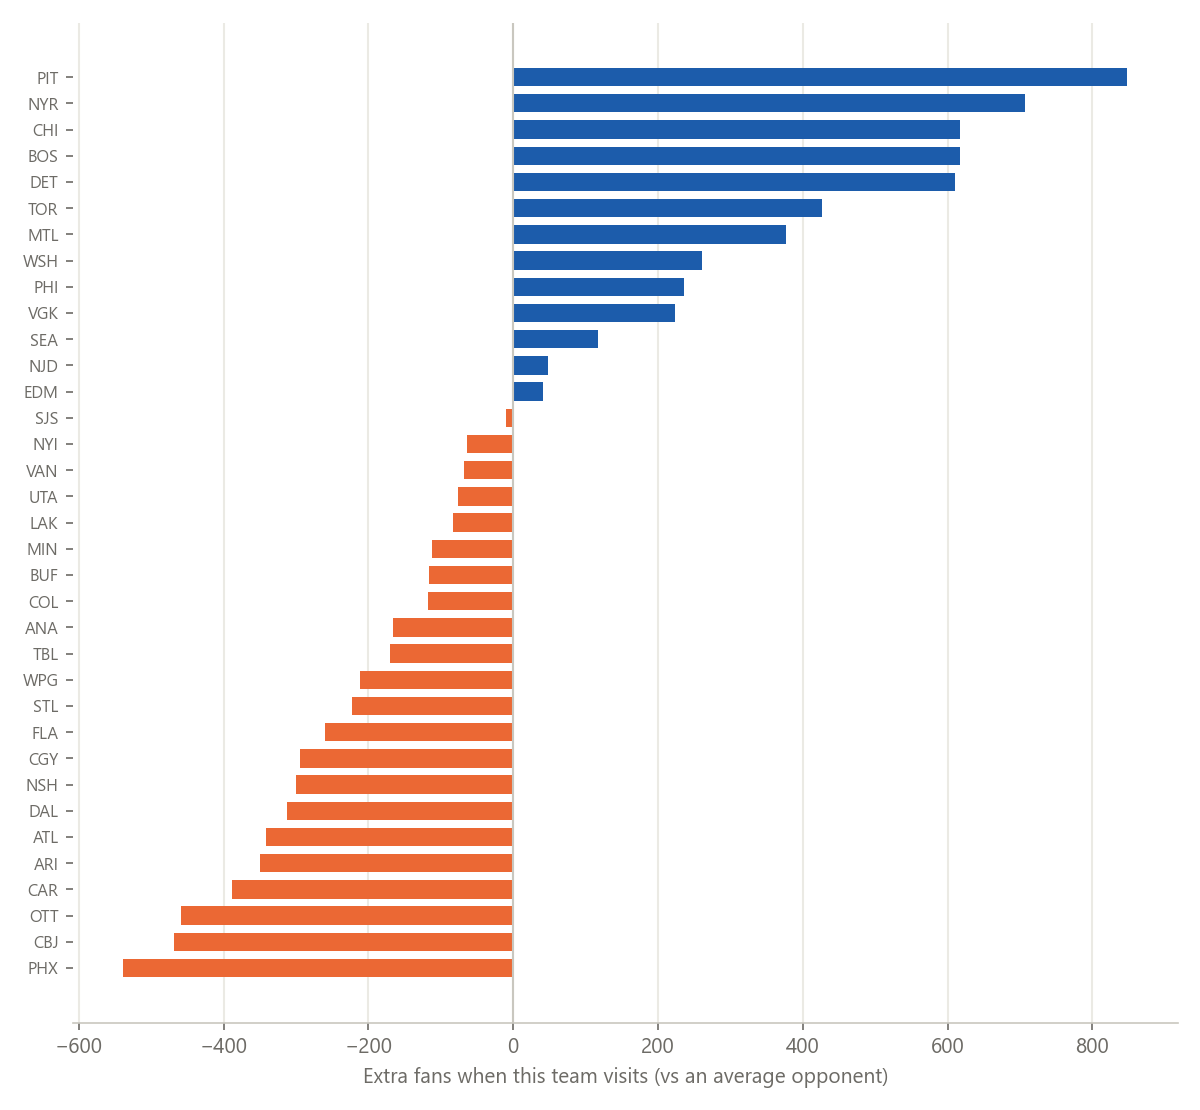
Visiting-team effects from the demand model, centred on the average opponent:
| Best draws | Fans | Weakest draws | Fans | |
|---|---|---|---|---|
| Pittsburgh | +848 | Phoenix (2008-14) | −539 | |
| NY Rangers | +706 | Columbus | −469 | |
| Chicago | +618 | Ottawa | −459 | |
| Boston | +617 | Carolina | −389 | |
| Detroit | +611 | Arizona | −349 | |
| Toronto | +426 | Atlanta | −342 | |
| Montreal | +377 | Dallas | −312 | |
| Washington | +260 | Nashville | −300 |
Five Original Six teams plus Pittsburgh lead. Visiting fans are part of it: the Rangers, Boston and Detroit draw better in sun-belt rinks. Fitting the model separately for sun-belt hosts (FLA, TBL, CAR, NSH, DAL, ARI/PHX, ANA, LAK, SJS, VGK, ATL, UTA) and the rest:
| Visitor | Sun-belt hosts | Other hosts | Gap |
|---|---|---|---|
| MTL | +892 | +87 | +805 |
| DET | +873 | +460 | +413 |
| BOS | +868 | +479 | +389 |
| PHI | +472 | +90 | +381 |
| PIT | +1,006 | +763 | +243 |
| CHI | +709 | +554 | +155 |
| TOR | +507 | +402 | +106 |
| NYR | +736 | +701 | +35 |
| WSH | +250 | +258 | −8 |
| EDM | −65 | +124 | −189 |
Montreal is an ordinary draw in northern buildings and one of the best in Florida, Tampa, Carolina and the desert: that is snowbirds and transplants, not star power.
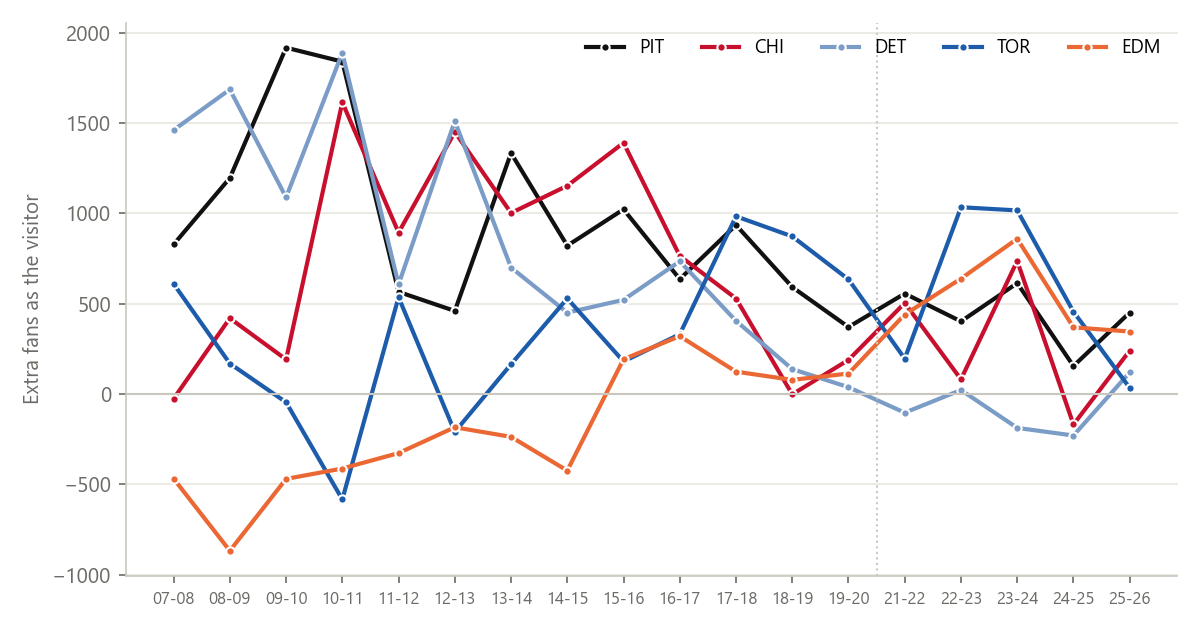
Stars and dynasties are worth fans, then fade. The same model with a separate draw for every visiting team-season:
- Pittsburgh was worth +1,900 a visit in 2009-11 (Crosby and Malkin, fresh off the 2009 Cup) and has been +155 to +615 since 2019.
- Chicago's dynasty (Cups 2010, 2013, 2015) was worth +900 to +1,600; it fell to zero by 2018-19, with a one-year +737 when Bedard arrived in 2023-24.
- Detroit was the best draw in the league in 2008-13 (+1,100 to +1,900) and has been neutral or negative since the rebuild.
- Edmonton was the worst draw in the league before McDavid (−180 to −870 in 2007-15). It turned positive in his rookie year and peaked at +860 in 2023-24.
- Toronto reached +1,000 in the Matthews/Marner years (2017-24) and dropped to zero in 2025-26.
- Vegas drew +692 in its first season, then nothing. The novelty lasted one year.
5. Does winning sell tickets?
Team-season panel, fixed effects for team and season, attendance per game, each extra 0.100 of points% (about 16 standings points over 82 games):
| Sample | Same season | Last season | Two seasons back | Total |
|---|---|---|---|---|
| All team-seasons (483) | +234 | +395 | +264 | ≈ +900 |
| Fill under 97% (225) | +336 | +469 | +263 | ≈ +1,070 |
- The gate lags the standings. Last season's record matters more than this season's, and two seasons back still counts. Season tickets are sold in the summer, so a good year shows up in next year's base.
- Within a season, the response is real but modest. In unsold buildings, after 20 games, a team running 0.100 points% better than its own season average draws about 380 more a game.
- A playoff run is the biggest single lift. Playoff crowds average 18,601 against 17,896 in the same team's regular season (+706), at 99.7% of capacity. The biggest jumps are teams that cannot fill in the regular season: Phoenix 2010-12 (12,000 → 17,300), Florida 2021-22 (14,800 → 19,700), Carolina 2018-19 (14,300 → 19,000), Columbus 2013-14 (14,700 → 19,100).
The sun-belt turnaround in section 2 is mostly this effect stacked over several years: Florida, Carolina, Dallas, Tampa and Colorado all filled up during long contending runs, and Chicago, Detroit and San Jose emptied during rebuilds.
6. Do crowds create home-ice advantage?
No measurable effect. Home edge is the home team's win probability (overtime and shootout included) for two teams of equal season points%, minus 50%. It comes from a logistic model fitted on normal seasons, with the intercept re-fitted for each group:
| Games | n | Home win % | Home edge | 95% CI |
|---|---|---|---|---|
| Normal seasons, all | 21,803 | 54.4% | +4.7 | ±0.7 |
| ... under 80% full | 2,374 | 49.6% | +4.2 | ±2.1 |
| ... 80-90% full | 2,498 | 51.2% | +4.1 | ±2.0 |
| ... 90-97% full | 3,611 | 55.5% | +6.1 | ±1.7 |
| ... 97-99% full | 3,131 | 56.0% | +4.4 | ±1.8 |
| ... sold out | 10,179 | 55.4% | +4.5 | ±1.0 |
| 2020-21, empty building | 556 | 51.6% | +4.0 | ±4.4 |
| 2020-21, limited crowd (avg 3,242) | 310 | 56.1% | +3.1 | ±5.9 |
| 2021-22 Canada, restricted (avg 9,138) | 87 | 50.6% | +2.9 | ±10.9 |
| 2021-22 Canada, open, same weeks | 89 | 52.8% | +5.1 | ±10.7 |
Raw home win% looks tied to crowd size (49.6% in under-80% buildings, 55% sold out), but that is team quality: bad teams play in empty buildings. Once both teams' strength is in the model, the home edge is the same +4 to +5 points in every fill band. The empty-building season is the cleanest test, and it kept almost all of the edge (+4.0 against +4.7). The interval is wide (±4.4), but it rules out a crowd effect much bigger than about half the advantage. Last change, the last line change and skipping travel are the likelier sources. This matches the schedule-only model, which finds home ice without needing crowd size.
7. Outdoor and special games
44 outdoor games since 2008 averaged 54,000. The record is the 2014 Winter Classic in Ann Arbor (Toronto at Detroit, 105,491), then Ohio Stadium 2025 (94,751), the Cotton Bowl 2020 (85,630) and MetLife 2024 (79,690 for Rangers-Islanders). Crowds have grown even as the events multiplied: the average went from 51,000 (2008-13) to 58,500 (2023-26). The European and Japanese openers (Premiere and Global Series) average about 13,800 in smaller arenas. The two Lake Tahoe games in 2021 had no fans.
Caveats
- Announced attendance is not a head count. Teams announce tickets distributed, and several announce a fixed sell-out number. A falling fill rate in this data means fewer tickets sold or given away, not necessarily fewer people.
- Capacity is estimated. It comes from each building's own best crowds. Mid-season renovations (the Rangers' Madison Square Garden rebuild in 2011-13, seating changes in Ottawa and Utah) can shift a season's figure by a point or two.
- No prices. Demand here is quantity only. A team that raised prices and lost 500 fans may have done better than one that held prices and sold out.
- Fan base vs visitors. The road-draw numbers mix the visitor's travelling and transplanted fans with locals who come to see a star. The sun-belt split separates part of this.
Files
fetch_attendance.py→Data/attendance_games.csv(game-level attendance, 2000-01 to 2025-26; blank before 2007-08).python fetch_attendance.py 2027refreshes one season.attendance_study.py→attendance_team_season.csv(team × season average, capacity, fill, sold-out share, points%),attendance_opponent_draw.csv,attendance_opponent_draw_by_season.csv,attendance_report_tables.md(every table),Figures/attendance_*.png.