When to pull the goalie
Run 2026-09-26 on every regular-season third period from 2010-11 to 2025-26 (19,152 games, 13,800 extra-attacker pulls). Produced by goalie_pull_study.py, with head coaches per game from fetch_game_coaches.py.
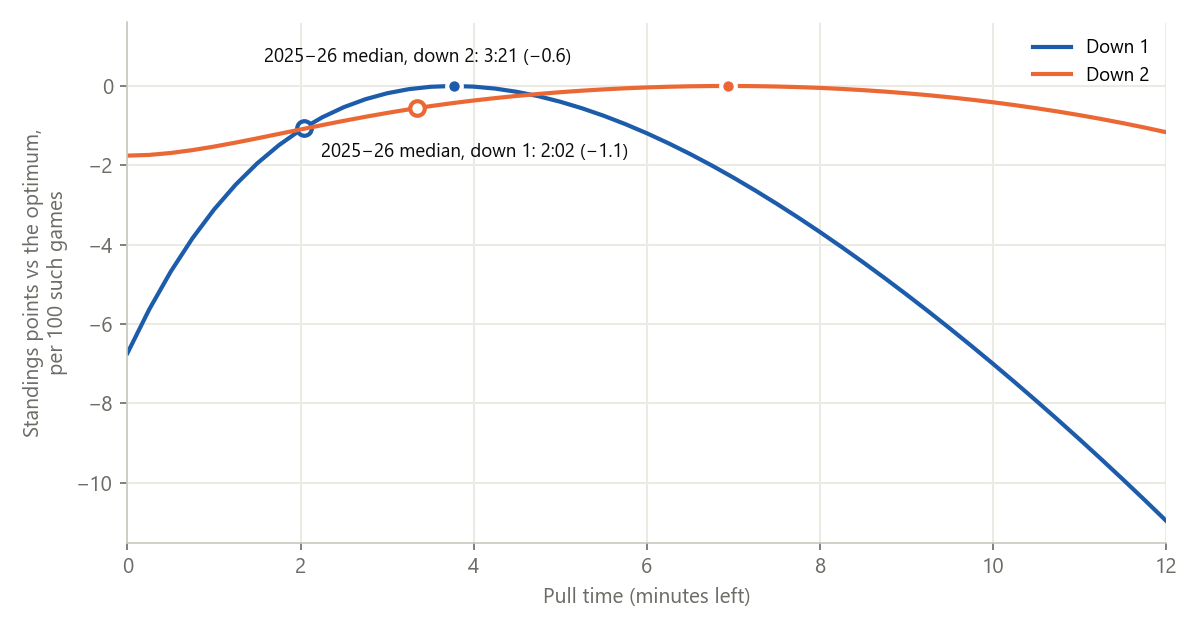
The short version. Our model says a team down one goal should pull its goalie with about 3:45 left, and a team down two with about 7:00 left. In 2025-26 the median NHL pull came at 2:02 down one and 3:21 down two. Coaches have moved about 45 seconds earlier (down one) and a minute and a half earlier (down two) since 2010-11, but they are still late. Waiting costs less than the debate suggests: the value curve is flat near the top, so a typical late pull gives up about 1 standings point per 100 such games. That comes to roughly a third of a point per team per season. Pull timing is also a stable coaching habit (split-half r = 0.79 after removing the league trend). Relative to their peers, Paul Maurice, Ryan Warsofsky, Jon Cooper and John Tortorella pull earliest, and Don Granato, Darryl Sutter and John Hynes latest. But the gap between the boldest and most cautious coach is worth only about a quarter of a point a season.
Method
Pulls. The play-by-play logs the manpower on the ice at every event (situation code AgAsHsHg). A pull is a goalie-out run for the trailing team: code 1560 for the home side, 0651 for the away side. The pull time is the midpoint between the last goalie-in event and the first goalie-out event. Delayed-penalty pulls are removed: a pull made while level or ahead is dropped, and so is a run that contains an opponent penalty with the goalie back within two seconds of the call. Only the first pull of each deficit spell (a stretch trailing by exactly one or two) counts. For timing statistics, the spell must also have started at least 60 seconds before the pull, so the coach had a real choice. A team that falls behind by one with 40 seconds left was not choosing a 0:35 pull. That leaves 10,551 of the 13,800 pulls.
Scoring rates. For the trailing team over the last 10 minutes of the third period: goals for and against per 60 minutes at 5-on-5 with the goalie in, and with the extra attacker (6-on-5). Time between two events in different states is split half and half. This also handles the common pattern of the goalie returning for a faceoff and leaving again a few seconds later.
Model. A per-second Markov chain over time left, deficit, and goalie in or out, driven by those rates. Dynamic programming finds the pull time that maximises expected standings points:
- Trailing at the horn is worth 0.
- Tying the game with t left is worth the empirical expected points of a tied team at that moment: 1 + 0.5 × P(the game reaches overtime | tied with t left). This is 1.37 points with 5:00 left and 1.49 with 0:30 left.
For any fixed pull time τ, the same chain gives the expected points of pulling at τ. The gap to the optimum is the cost of pulling late.
Scoring rates late in games (2018-19 to 2025-26)
| Trailing by | Goalie | Goals for / 60 | Goals against / 60 | Hours |
|---|---|---|---|---|
| 1 | in (5v5) | 2.38 | 2.01 | 381 |
| 1 | pulled (6v5) | 6.40 | 19.04 | 72 |
| 2 | in (5v5) | 2.36 | 2.31 | 228 |
| 2 | pulled (6v5) | 6.49 | 22.56 | 63 |
Pulling the goalie multiplies the trailing team's scoring by about 2.7, and its goals against by about 9.5. When down one, a goal for is worth far more than a goal against costs: one ties the game, the other only turns a loss into a slightly bigger loss. That asymmetry is the whole case for pulling early.
The optimal pull
| Seasons | Down 1 | Down 2 | Down 3 |
|---|---|---|---|
| 2010-11 to 2017-18 | 4:21 | 7:06 | 16:37 |
| 2018-19 to 2025-26 | 3:46 | 6:56 | 15:56 |
| all 16 seasons | 4:01 | 6:59 | 15:49 |
Down three, the answer is “pull early, it barely matters”. The chance of coming back is small either way (see the caveats).
Sensitivity: the final minute is special. With the goalie pulled, goals against run at 24.7 per 60 in the final minute but 10.7 per 60 with two to three minutes left. Part of that gap is desperation and the clock, and part is that early pulls are chosen when a team has possession. The base model pools the whole 10-minute window, so the extra-attacker rates are dominated by the final minute. Re-estimating them from 1 to 10 minutes left (final minute excluded) moves the optimum earlier: 4:05 down one and 8:10 down two. The base figures are the conservative ones.
Does the model reproduce what happens?
Chance of getting back to a tie before the horn, for teams trailing at the moment shown, 2018-19 to 2025-26. The model plays the league’s actual median pull times for these seasons (1:57 down one, 2:59 down two):
| Trailing | At | Actual | Model | Games |
|---|---|---|---|---|
| by 1 | 5:00 | 0.243 | 0.226 | 3,234 |
| by 1 | 3:00 | 0.189 | 0.174 | 3,232 |
| by 1 | 2:00 | 0.151 | 0.146 | 3,163 |
| by 1 | 1:00 | 0.107 | 0.088 | 2,634 |
| by 2 | 5:00 | 0.034 | 0.034 | 2,190 |
| by 2 | 3:00 | 0.016 | 0.022 | 1,992 |
| by 2 | 2:00 | 0.007 | 0.013 | 1,713 |
Close. The model runs one to two points low when down one, most likely because it ignores late power plays: trailing teams draw penalties late, and a power play with the goalie pulled is 6-on-4.
What coaches do
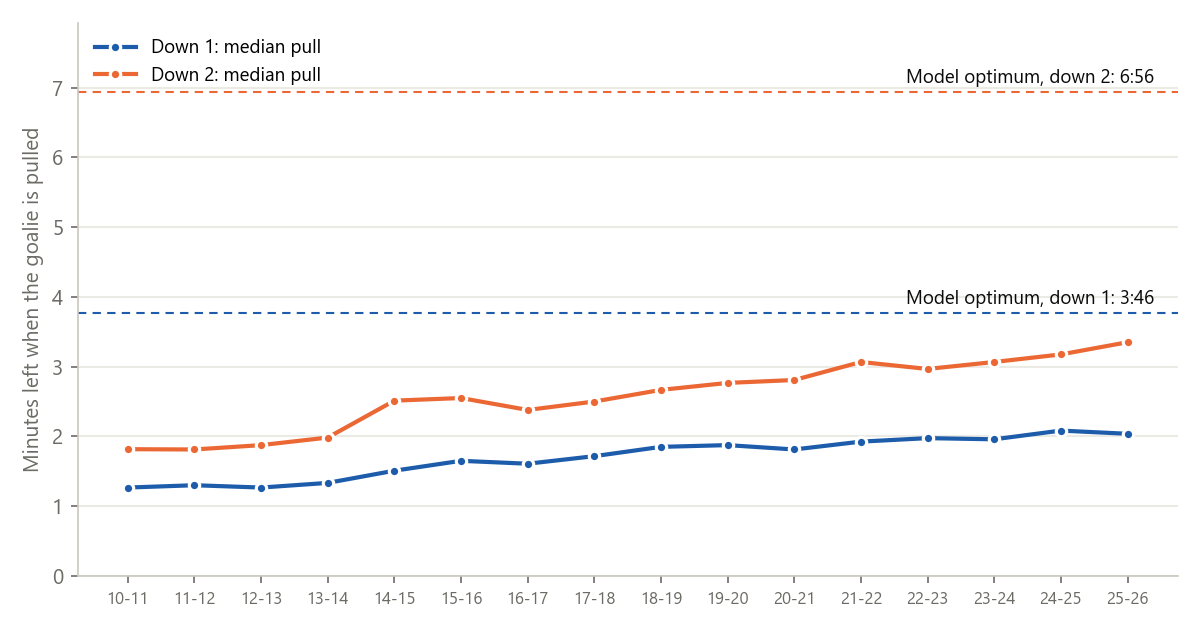
The drift is steady rather than sudden: the down-one median rose in 11 of the 15 season-to-season steps. Down one, the median has moved from 1:16 to 2:02. Down two, it has moved from 1:49 to 3:21. Neither is anywhere near the optimum.
What waiting costs
| Pull at | Down 1 | Down 2 |
|---|---|---|
| 1:00 | −3.1 | −1.5 |
| 2:00 | −1.1 | −1.1 |
| 3:00 | −0.2 | −0.7 |
| optimum | 0 (3:46) | 0 (6:56) |
| 5:00 | −0.4 | −0.2 |
Standings points per 100 games against the optimum. The curve is flat near the top. The expensive mistake is the old 1:00 pull down one, which costs three points per 100 games. Today’s 2:00 pull costs about one.
Coaches
Pull timing is a coaching habit, not noise. Split each coach’s down-one pulls into alternating halves, and the halves agree closely: r = +0.86 on raw times, and r = +0.79 after removing each season’s league median, so the league-wide trend isn’t driving it (55 coaches with 40+ pulls, 2010-11 to 2025-26). Coaches also move with the league: every coach in the tables below has a 2018-26 median earlier than the whole league managed in 2012-13 (1:16).
The tables cover 2018-19 to 2025-26 and the 46 head coaches with at least 25 down-one pulls where they had a choice. vs league is the median gap, in seconds, between the coach’s pull and that season’s league median (positive = earlier). Points lost / season prices the coach’s median pull times with the model: every game trailing at the optimum (or at the coach’s own pull time, if that is earlier) is charged the value gap, and the total is divided by the seasons coached.
Earliest pullers
| Coach | Pulls down 1 | Median pull, down 1 | vs league that season | Median pull, down 2 | Points lost / season |
|---|---|---|---|---|---|
| Paul Maurice | 87 | 2:14 | +18 s | 2:59 | 0.26 |
| Ryan Warsofsky | 34 | 2:18 | +15 s | 3:19 | 0.36 |
| Jon Cooper | 92 | 2:07 | +14 s | 3:20 | 0.28 |
| John Tortorella | 65 | 2:12 | +14 s | 3:16 | 0.28 |
| Dean Evason | 49 | 2:08 | +12 s | 3:21 | 0.19 |
| Bruce Boudreau | 41 | 2:04 | +12 s | 2:50 | 0.28 |
| Rod Brind'Amour | 85 | 2:09 | +11 s | 3:10 | 0.26 |
| Jared Bednar | 76 | 2:10 | +9 s | 3:12 | 0.23 |
Latest pullers
| Coach | Pulls down 1 | Median pull, down 1 | vs league that season | Median pull, down 2 | Points lost / season |
|---|---|---|---|---|---|
| Don Granato | 43 | 1:33 | −20 s | 2:28 | 0.54 |
| Darryl Sutter | 33 | 1:34 | −18 s | 3:08 | 0.41 |
| John Hynes | 74 | 1:41 | −16 s | 2:50 | 0.41 |
| Rick Bowness | 51 | 1:41 | −14 s | 3:02 | 0.34 |
| Scott Arniel | 30 | 1:49 | −14 s | 2:48 | 0.47 |
| Mike Sullivan | 98 | 1:47 | −14 s | 2:50 | 0.41 |
| D.J. Smith | 58 | 1:40 | −13 s | 2:27 | 0.38 |
| Bob Boughner | 43 | 1:42 | −11 s | 2:42 | 0.46 |
The spread is real but small. The boldest coach in this group pulls about 38 seconds earlier than the most cautious, and every coach still gives up between 0.19 and 0.54 points a season to the optimum. Down-two timing is much less consistent within a coach: several early down-one pullers are late when down two (Paul Maurice, Lindy Ruff), and the reverse.
Teams
Priced the same way, the average team gave up 0.76 points to late pulls in 2010-11 and 0.35 in 2025-26. The worst team-season in the data lost 1.27. That is below the noise of a standings race, but it is free. Coaches have been collecting it slowly for 15 years, and there is about as much again still available.
Caveats
- Constant rates. The chain assumes one scoring rate per state across the window. The final minute runs hotter than earlier minutes (see the sensitivity above), and that difference would move the optimum earlier, not later.
- Selection. The 6-on-5 rates come from pulls coaches chose to make, usually with possession in the offensive zone. An early pull made at a random moment might score less. The rates for 2 to 3 minutes left rest on only 8 hours of play.
- Power plays ignored. Only 5-on-5 and 6-on-5 time is modelled. See the validation.
- Tie value. A tie is valued with the league-average expected points of a tied game. A team that has just come back is treated like any other tied team.
- Goal difference. Goal difference is a tiebreaker, and pulling early means conceding more empty-net goals. That cost is real but tiny and is not counted.
- Coach attribution. The pull is credited to the head coach listed for the game. Some benches delegate the call.
Files
goalie_pull_study.py (log Logs/goalie_pull_study.log) → goalie_pull_events.csv (every pull), goalie_pull_spells.csv (every trailing spell), goalie_pull_rates.csv, goalie_pull_ties.csv, goalie_pull_coaches.csv, goalie_pull_team_seasons.csv, goalie_pull_summary.json, Figures/goalie_pull_*.png. Coaches: fetch_game_coaches.py → Data/game_coaches.csv.